Establishing a Unified Cost Data Model for Category-Level Decisions
Cost visibility wasn’t the problem. Decision clarity was.
Company
Kroger
MY ROLE
Product Design Lead
SCOPE
Enterprise Strategy & Cost Systems
CONSTRAINTS
Legacy Infrastructure, 6-Month Timeline
Strategic Context
In the low-margin world of retail grocery, category
managers are tasked with balancing promotional
aggression with bottom-line health. For Kroger, the
data existed, but it lived in siloed "cost-pockets" which were fragmented spreadsheets and legacy procurement systems.
As the Lead Product Designer, my objective was to
synthesize these disparate data points into a single, authoritative architectural model that could power real-time negotiation and pricing decisions across thousands of SKUs.
“We didn’t just need a new dashboard. We needed to redefine the fundamental relationshipbetween a buyer and their data, shifting the UX from ‘passive reporting’ to ‘predictive intelligence’.”
The Real Problem
01
The “Shadow Cost” Paradox
Managers were making category decisions based on net costs that didn't account for back-end logistics and regional distribution variances, leading to phantom profit loss.
02
Latency in Leverage
Vendor negotiations were reactive. By the time a cost
increase was identified and analyzed, the opportunity for
strategic push-back or SKU substitution had passed.
03
Trust Deficit
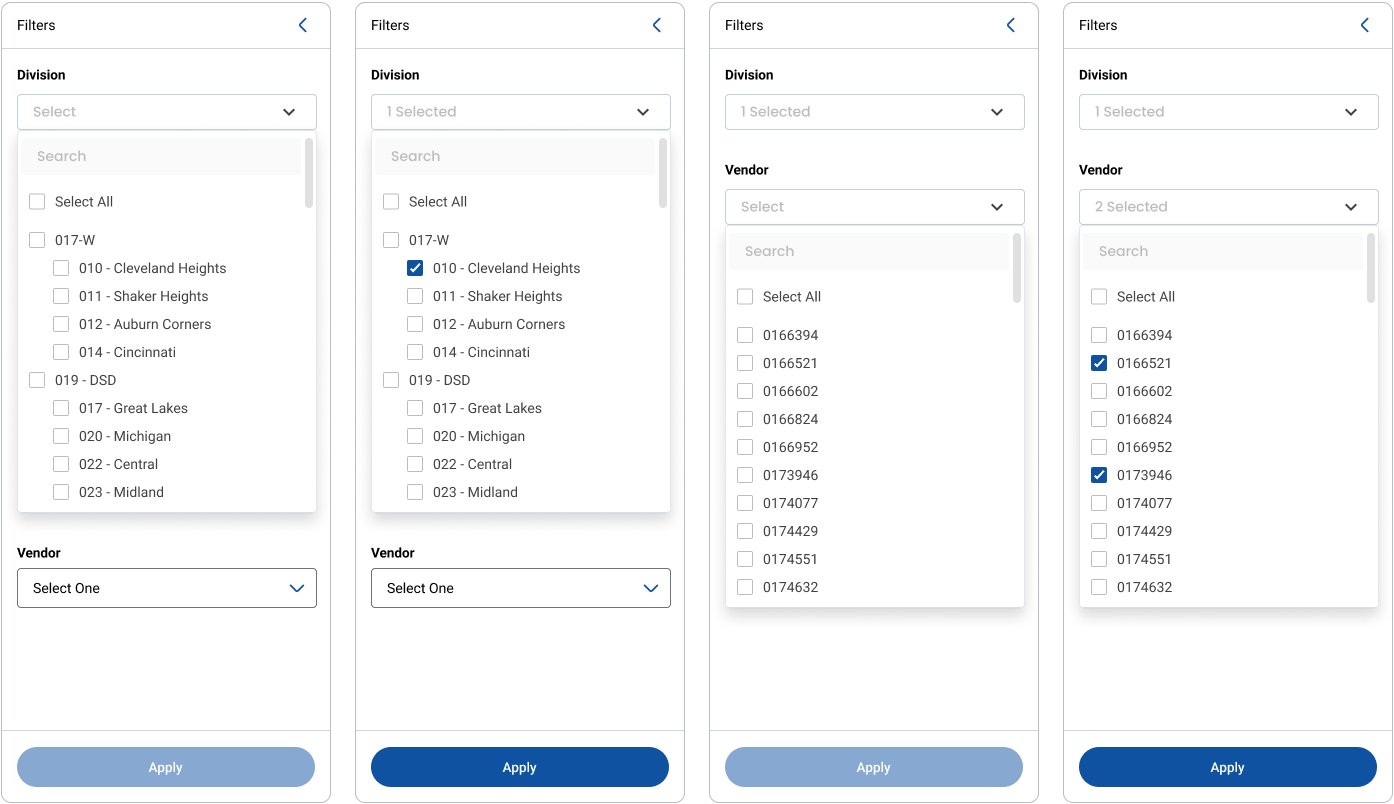
Different departments (Merchandising vs. Finance) utilized different data truths. This created organizational friction rather than unified strategic action during planning cycles.
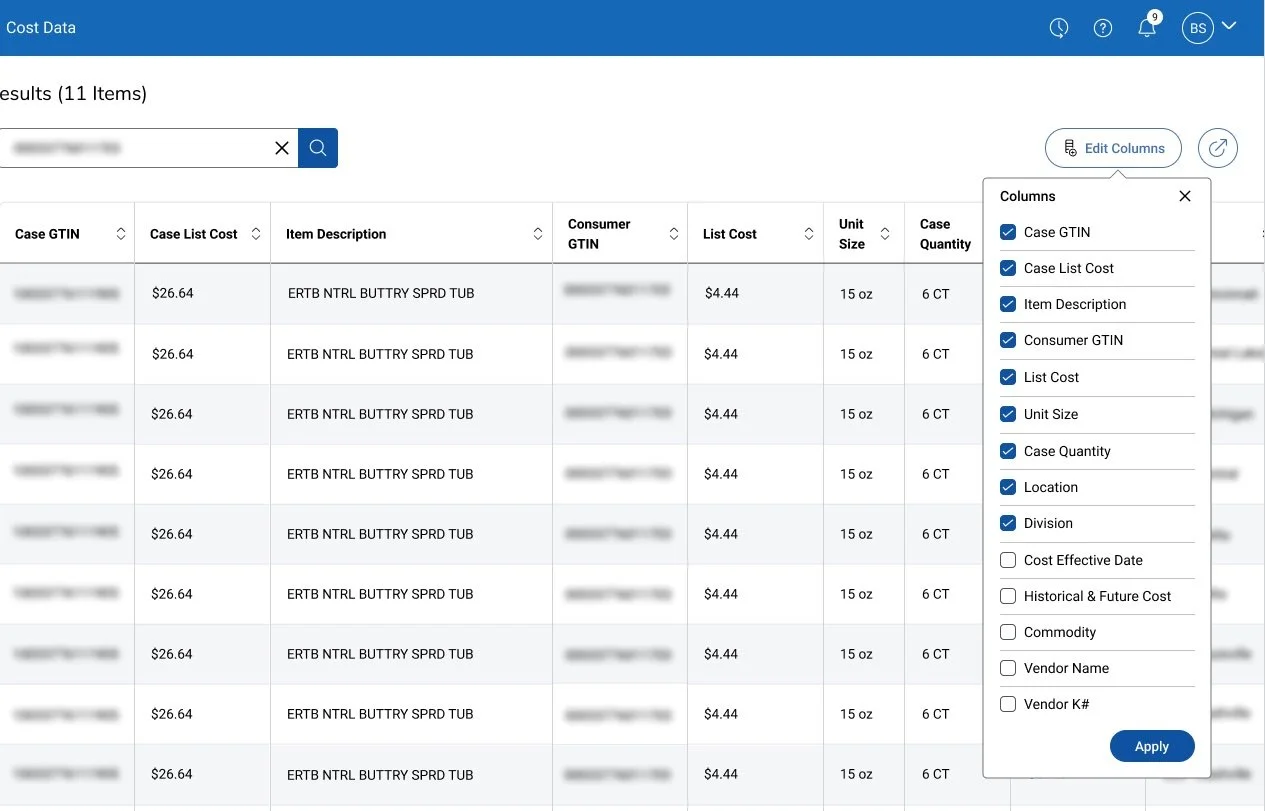
04
Interface Cognitive Load
The existing technical interfaces required "spreadsheet gymnastics." Users spent 80% of their time cleaning data and only 20% actually analyzing it.
Reframing the
Decision Space
Navigating the friction between legacy infrastructure and futuristic
commerce to build a unified strategic engine.
My Responsibility
Mapping recurring patterns
Identifying latent behavioral loops across millions of daily Kroger transactions to standardize architected responses.
Surfacing Tradeoffs
Exposing the friction between operational efficiency and customer-centric flexibility in the fulfillment engine.
Designing shared mental models
Creating a visual and conceptual vocabulary that allowed product, engineering, and logistics to align on success metrics.
Why This Was Hard
Conflicting cost signals
Balancing short-term labor costs against long-term customer lifetime value in a high-volume low-margin environment.
Legacy rigidity
Interfacing with 20-year-old mainframe systems that were never designed for the velocity of modern digital grocery.
Data silos
Bridging the intelligence gap between supply chain logistics and the digital storefront experience.
Outcomes & Growth
From fragmented inputs to automated strategic outcomes.
Legacy Friction
Manual intervention points, fragmented data entry, and reactive decision cycles.
Strategic Pivot
Unified logic layer translating business intent into system-level executable rules.
Outcome Engine
Autonomous optimization of picking paths, substitution logic, and inventory allocation.
Making Time & Risk Implicit
The Real Problem
Supply chain volatility often hides in plain sight. Traditional systems track what happened, but fail to visualize the "velocity of risk" — the temporal gap between a cost trigger and its bottom-line impact.
Historical cost changes
Retrospective analysis of pricing trends to identify vendor behavior patterns and seasonal fluctuations that impact procurement cycles.
Upcoming cost changes
Forward-looking forecasting that aligns inventory strategy with anticipated market shifts, ensuring margin preservation before the event.
Risk Exposure Tracking
Quantifying the dollar-at-risk for unhedged materials, providing the C-suite with a real-time dashboard of enterprise vulnerability.
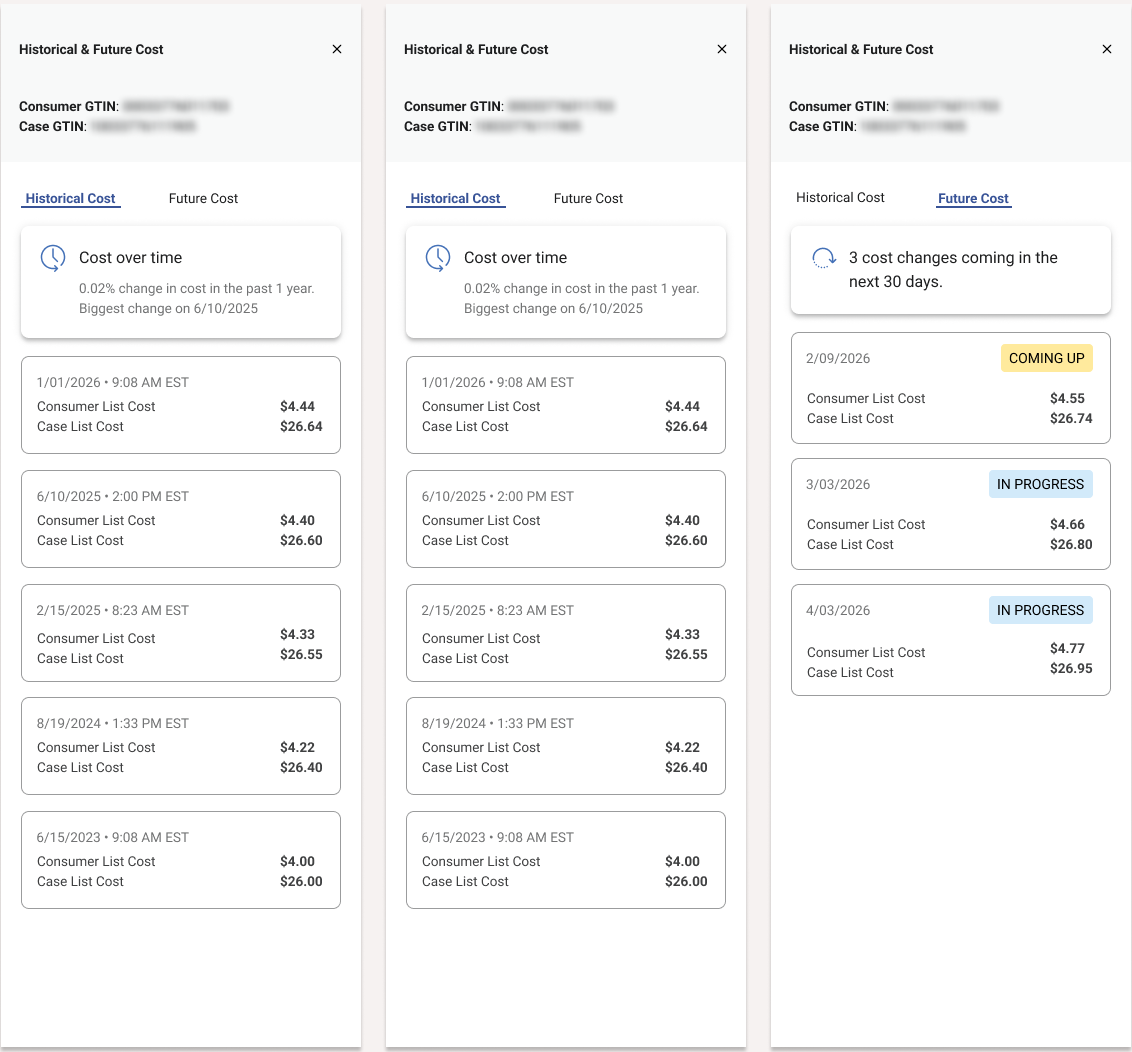
Transparency isn’t just about showing data; it’s about making the consequence of time unavoidable.
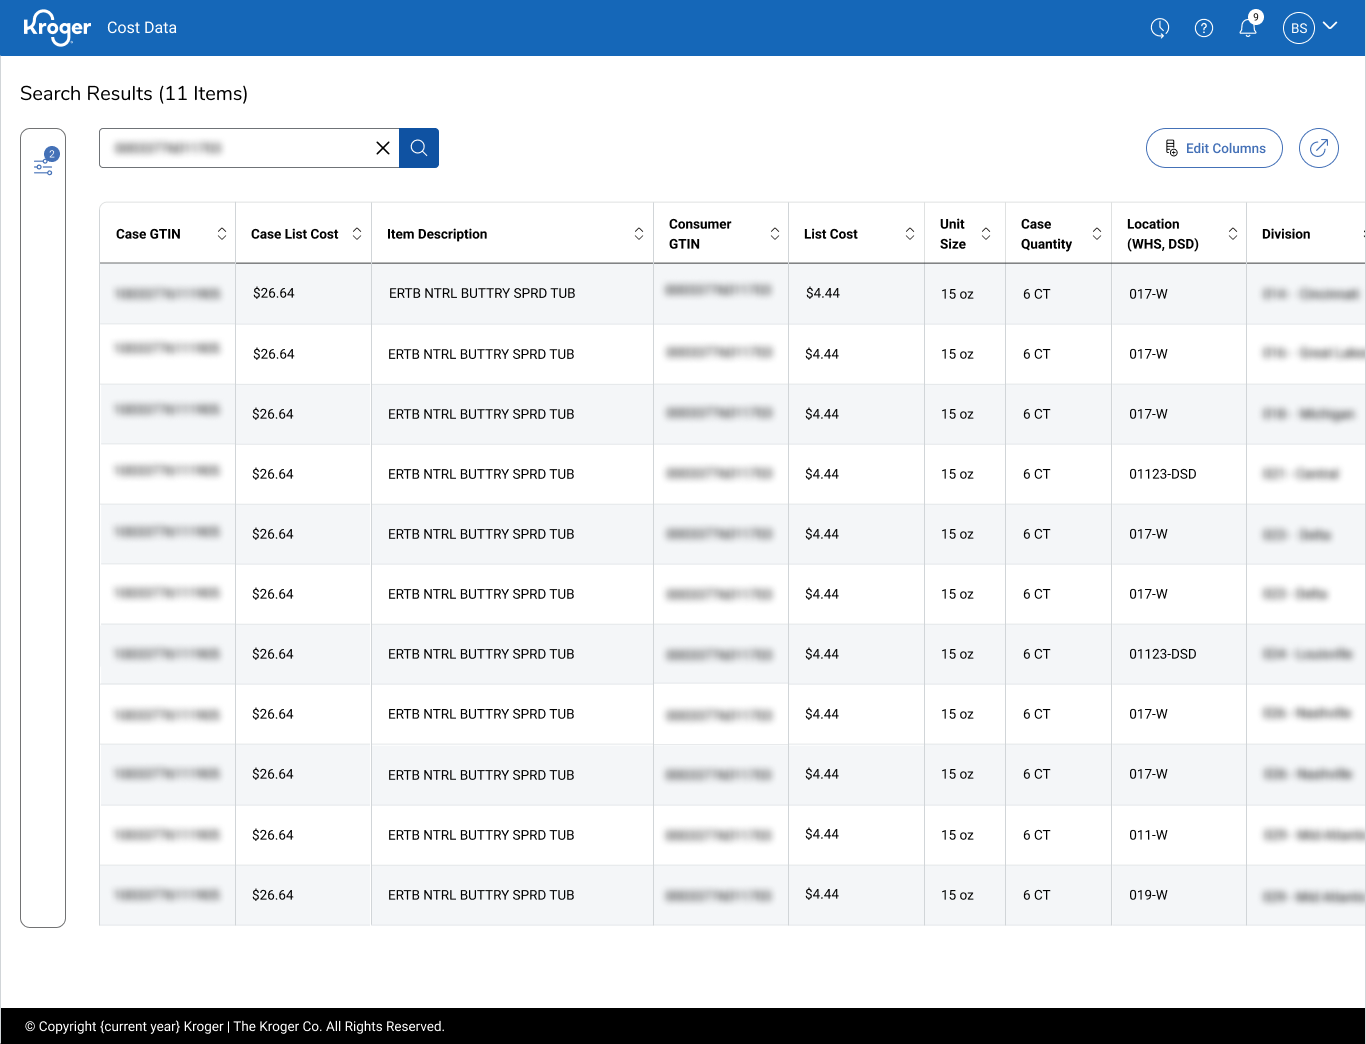
This was not a reporting artifact. It operationalized shared decision logic across divisions.
Standardized cost interpretation
Eliminating semantic drift across disparate regional procurement teams through a central logical definitions layer.
Unified GTIN relationships
Automated mapping of complex manufacturer hierarchies ensuring price parity and rebate eligibility accuracy.
Surfaced downstream impact indicators
Predictive modeling that visualizes how minute upstream shifts cascade into shelf-edge margin volatility.
The Strategy
By digitizing the decision architecture, we transformed a fragmented reconciliation process into a unified, high-velocity operational workflow.
Cycle Optimization
Reduced end-to-end processing time by centralizing disparate data streams into a single, actionable truth source.
Reconciliation Efficiency
Automated variance detection and resolution workflows, minimizing manual intervention in complex financial audits.
Timing Alignment
Synchronized operational schedules with financial reporting windows to eliminate critical data lags.
Structured Auditability
Established a permanent, immutable digital trail for every organizational decision and data modification.
Building for the next billion.
Interested in how we leverage modular architecture to drive enterprise-wide transformation? Let's discuss your next system.