A single source of truth for Kroger's category cost decisions.
A unified cost data model that replaced spreadsheet trackers and tool-by-tool reconciliation — and spread beyond the team it was built for.

In low-margin grocery, every penny on a SKU matters. But Kroger's category managers were making cost decisions from data scattered across procurement systems, regional pricing tools, and personal spreadsheets, each with its own version of the truth.
I led design on a unified cost data platform: one model, one source, one place where category managers, finance, and sourcing could see the same numbers and act on them in time.
Cost visibility wasn't the problem. Decision clarity was.
The fix wasn't another dashboard.
It was a shared model.
Designing for the question, not the spreadsheet.
I started by sitting with category managers as they did their actual work which meant pulling cost reports, reconciling them against vendor agreements, exporting to Excel, layering in their own assumptions. The same moves, every Monday.
The new model wasn't a redesign of the old reports. It was a reframe: instead of optimizing for "what does the data say," we optimized for "what decision are you about to make, and what do you need to make it." Filters, defaults, and sort order all flowed from that question.

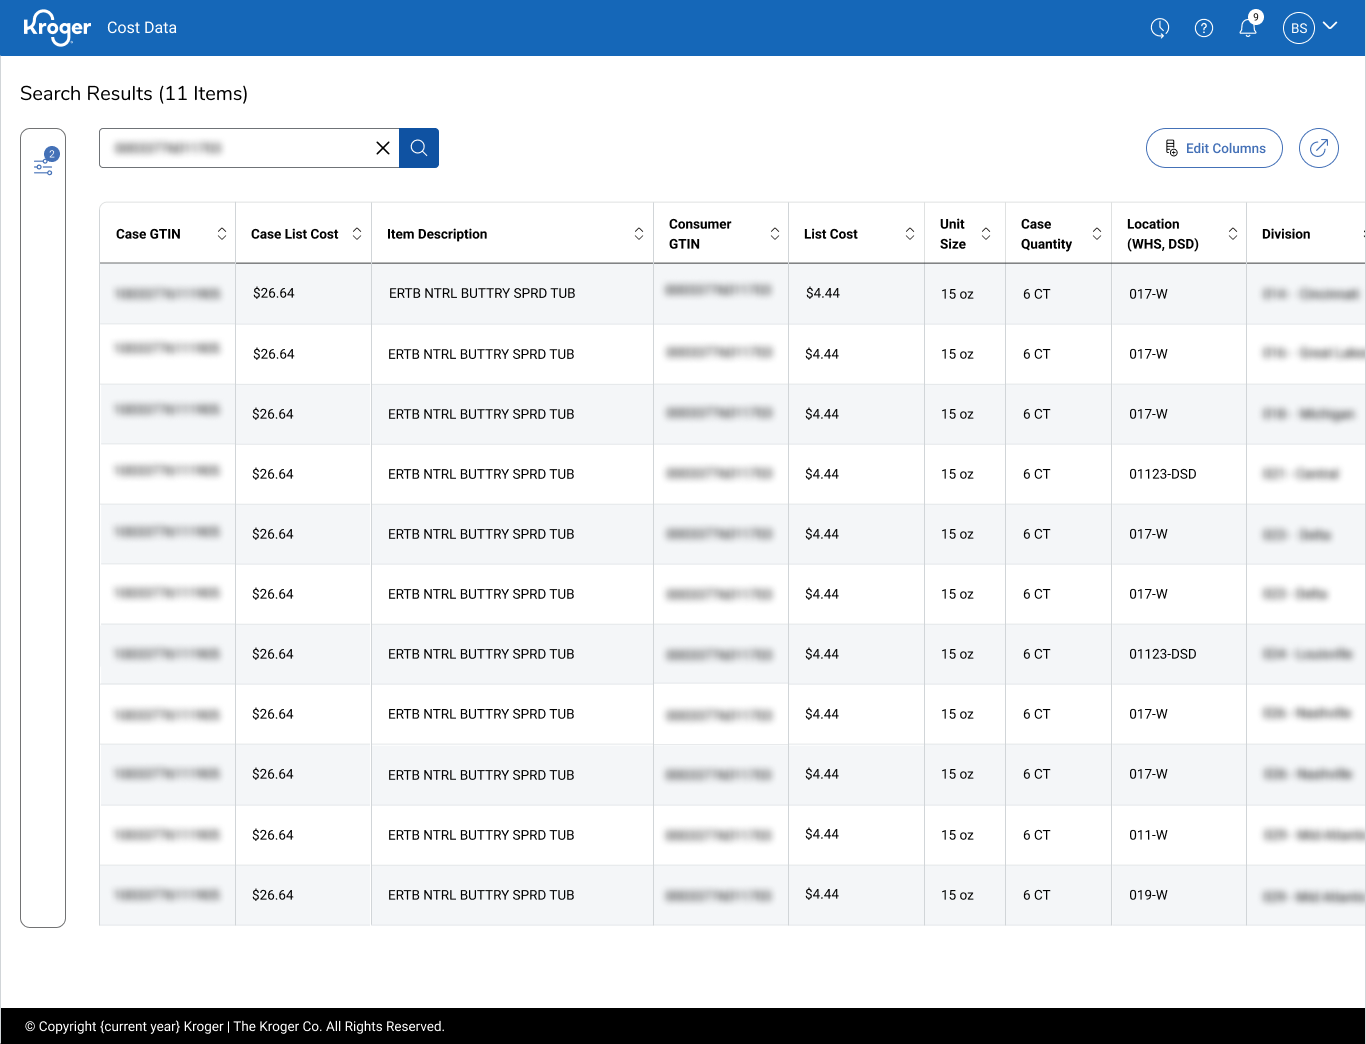
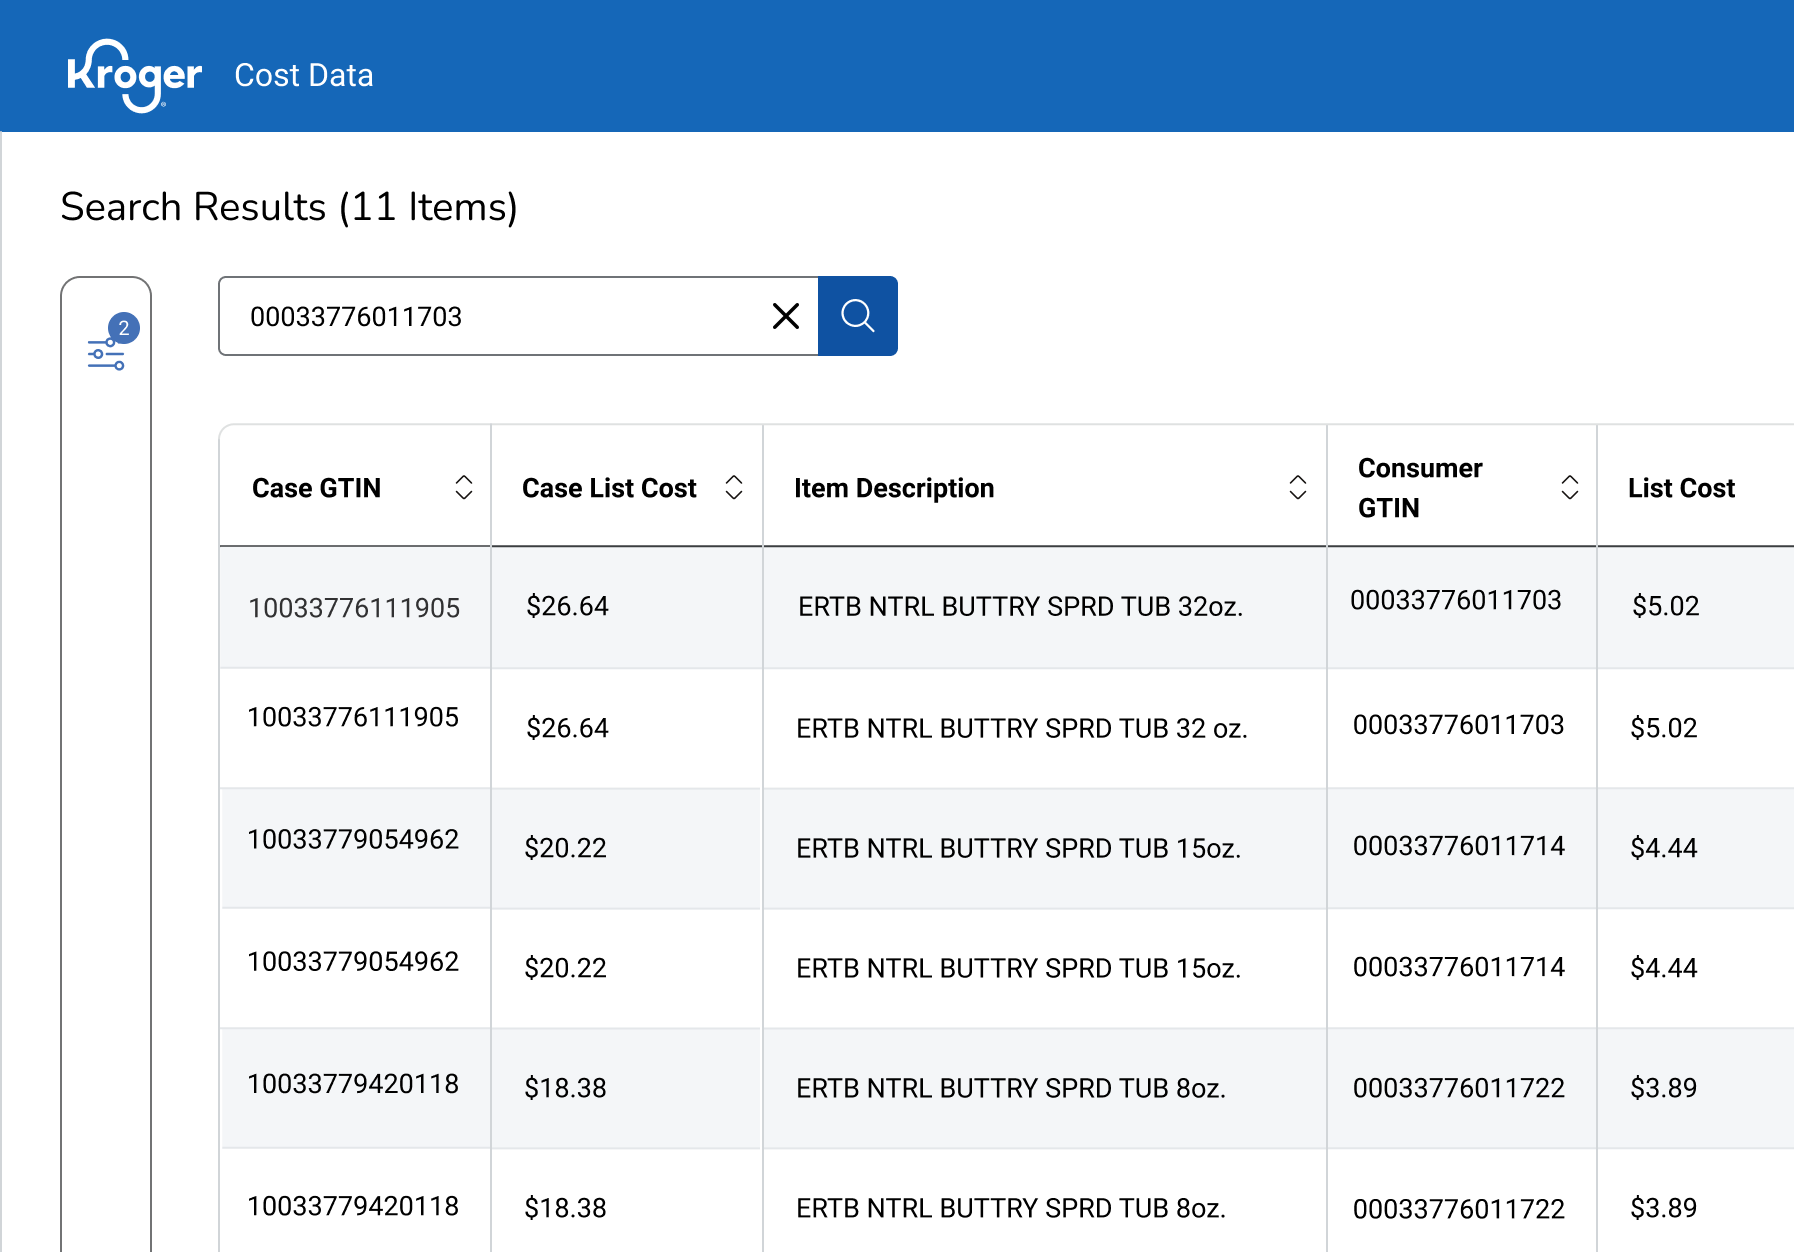
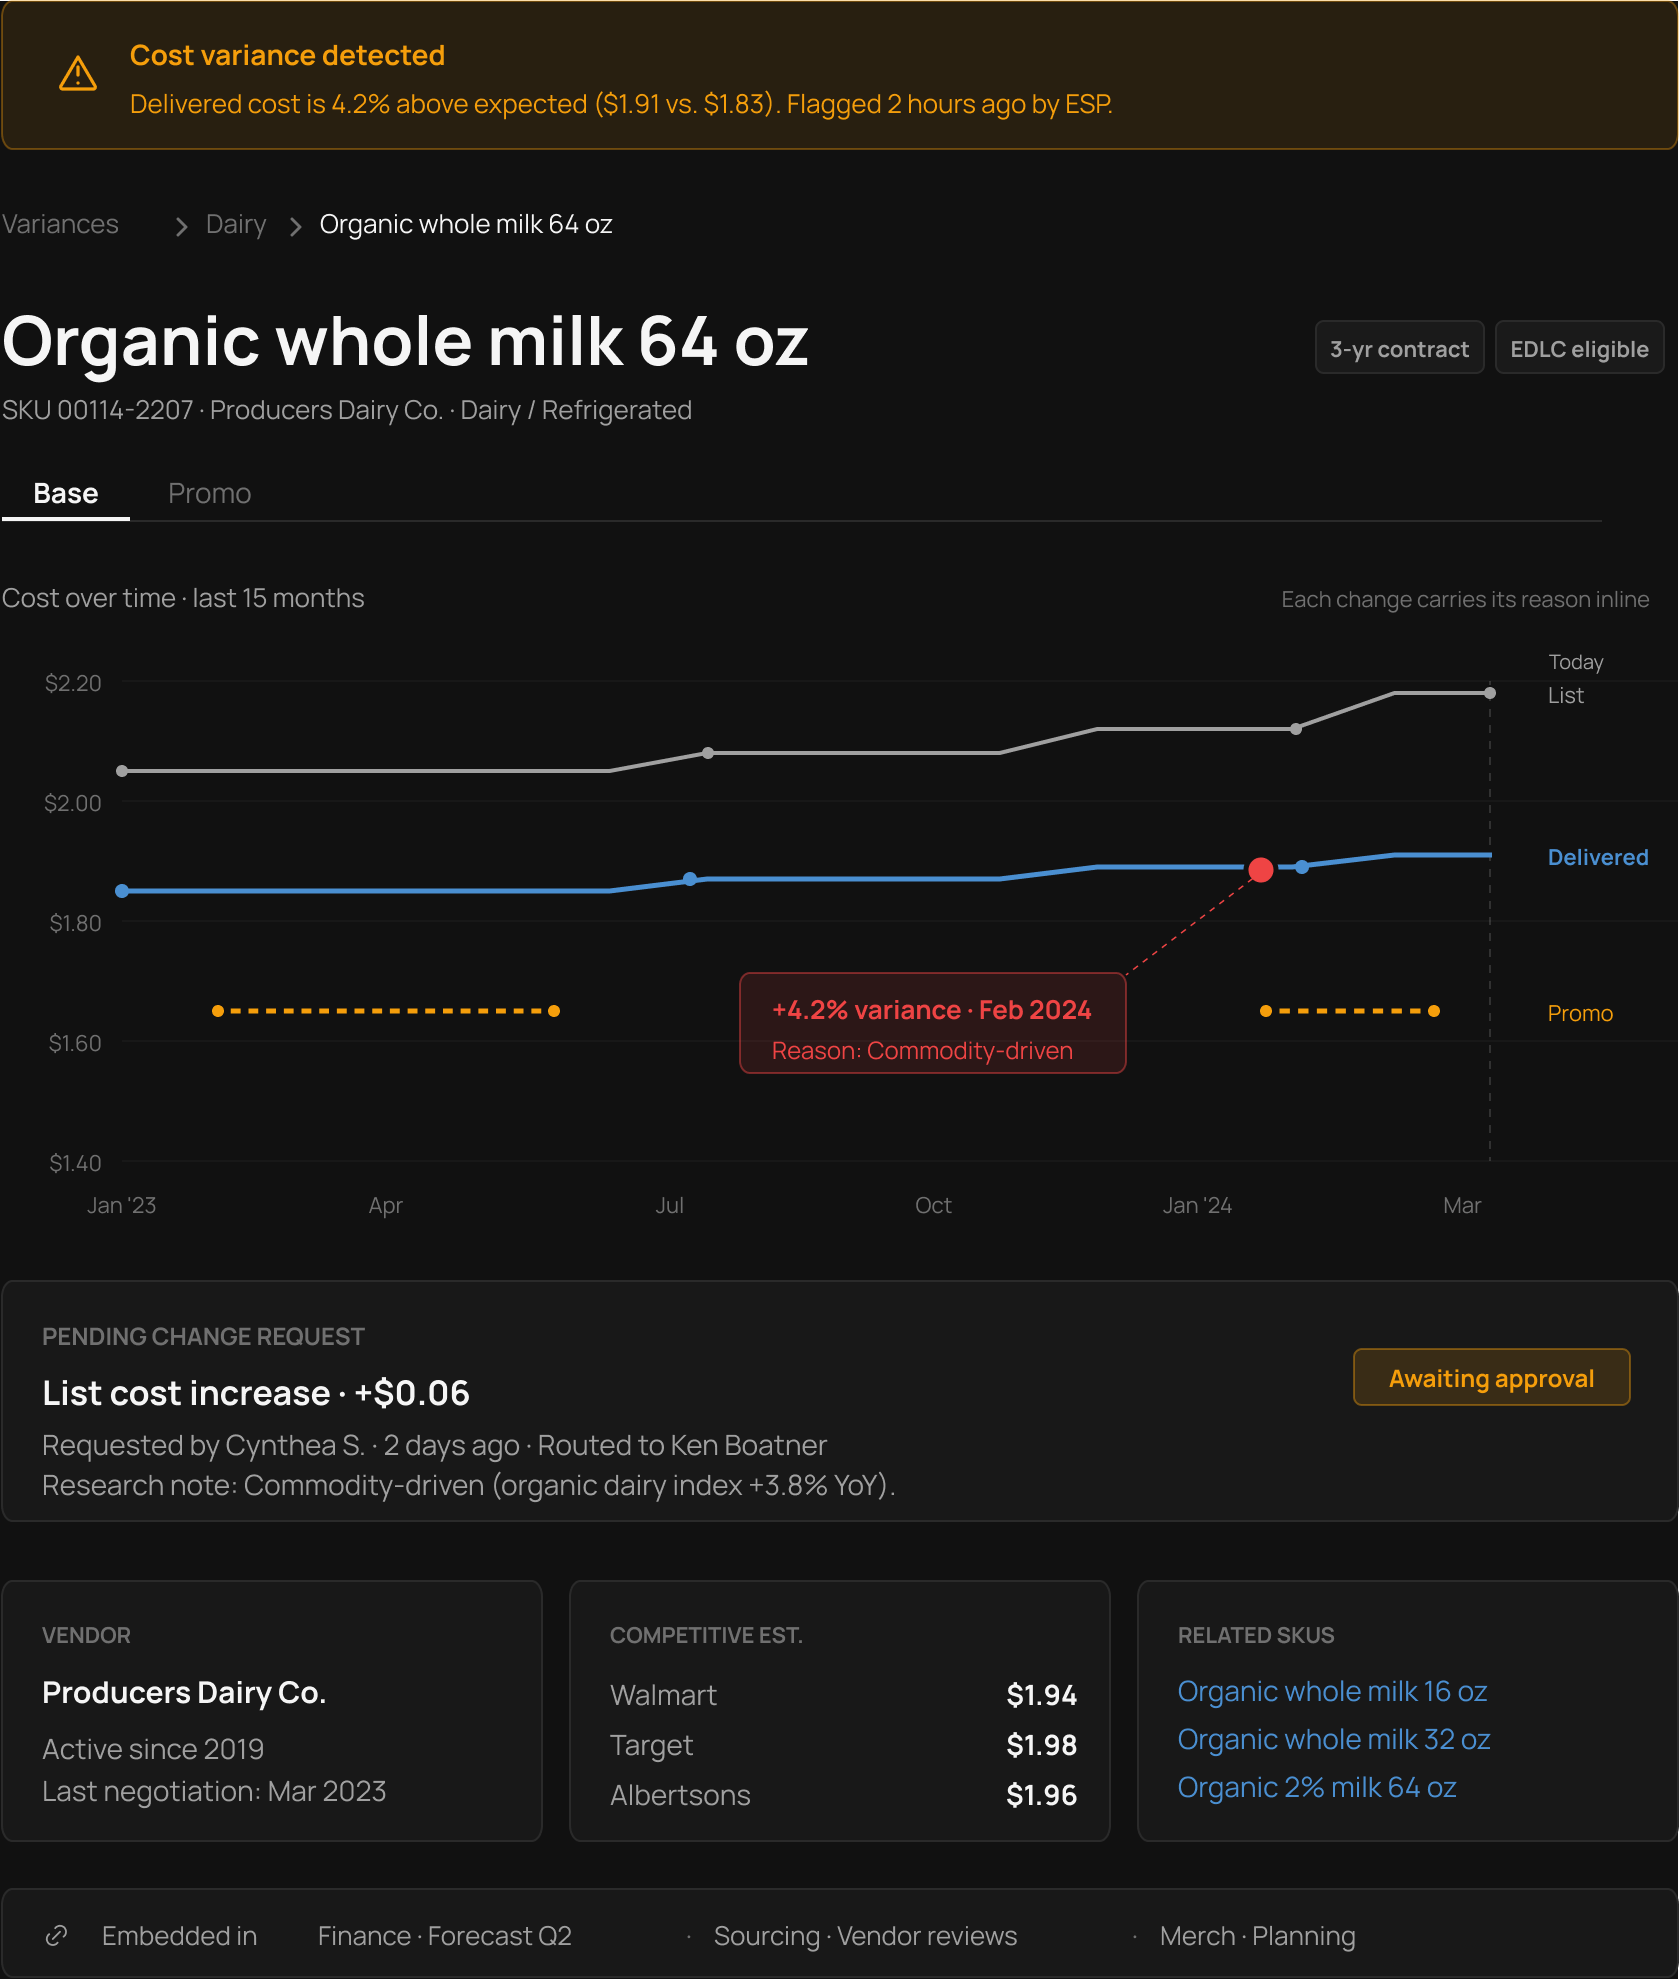
Historical cost, made legible at a glance.
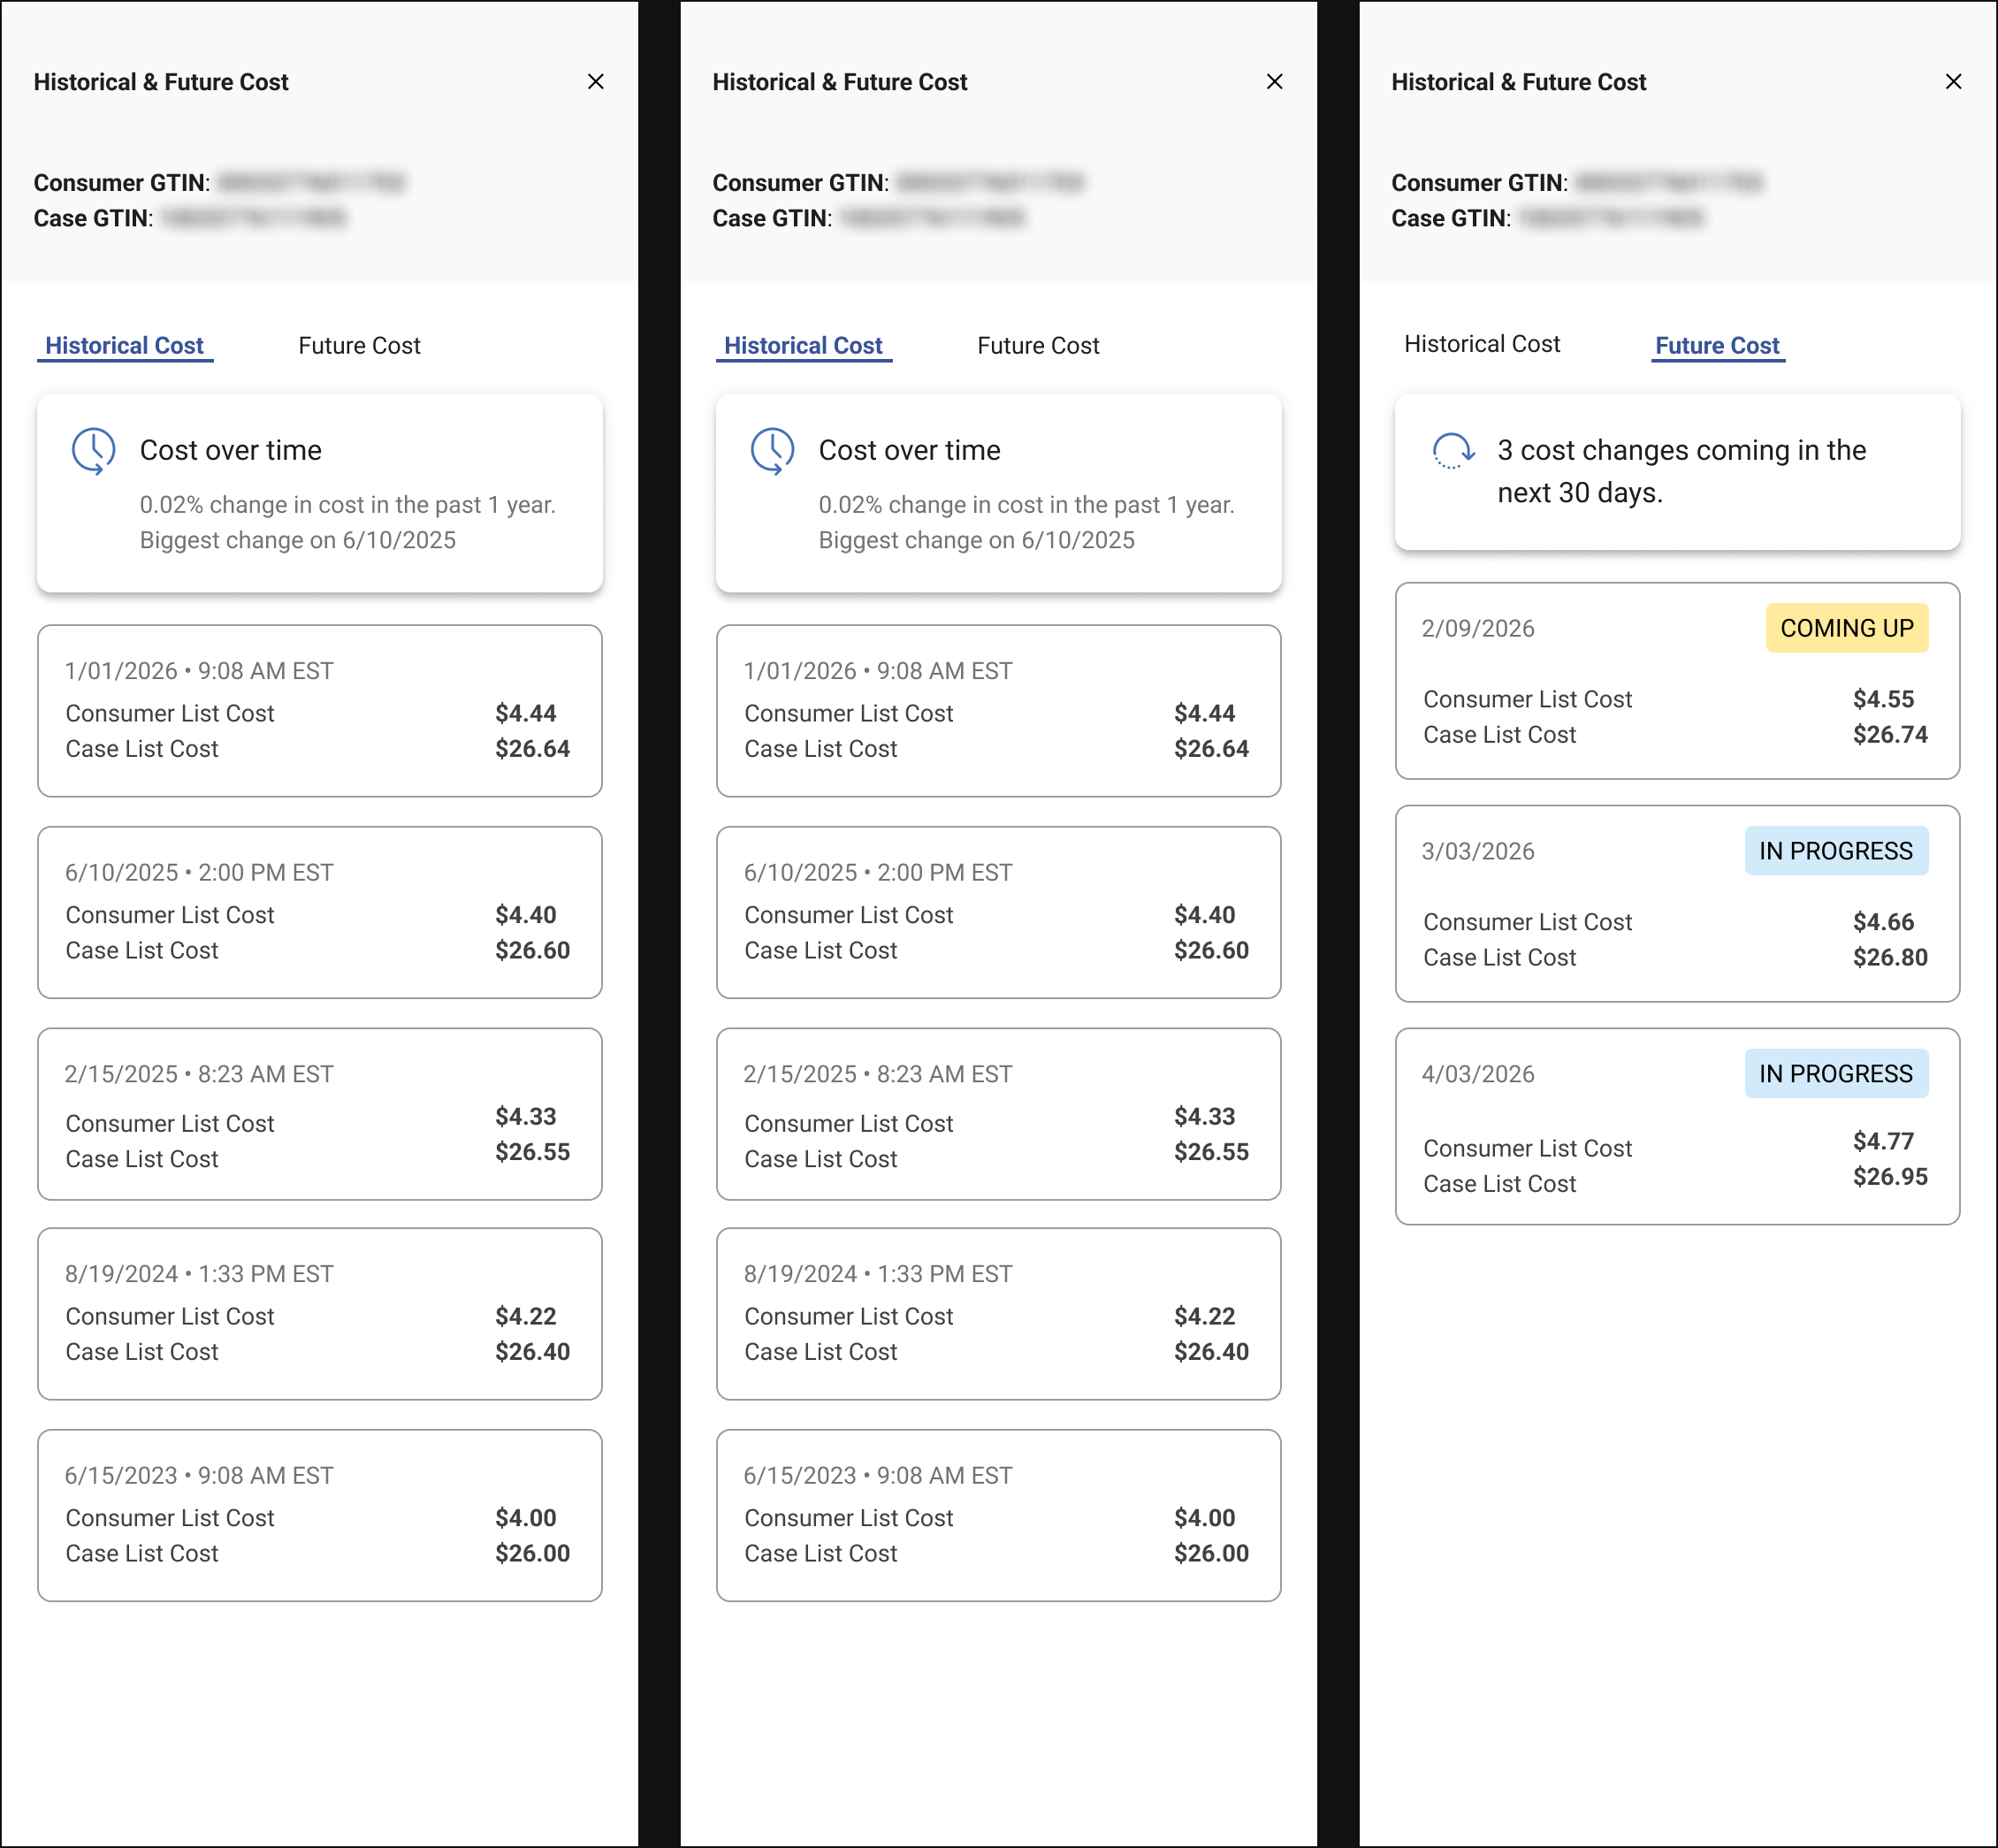
One number.
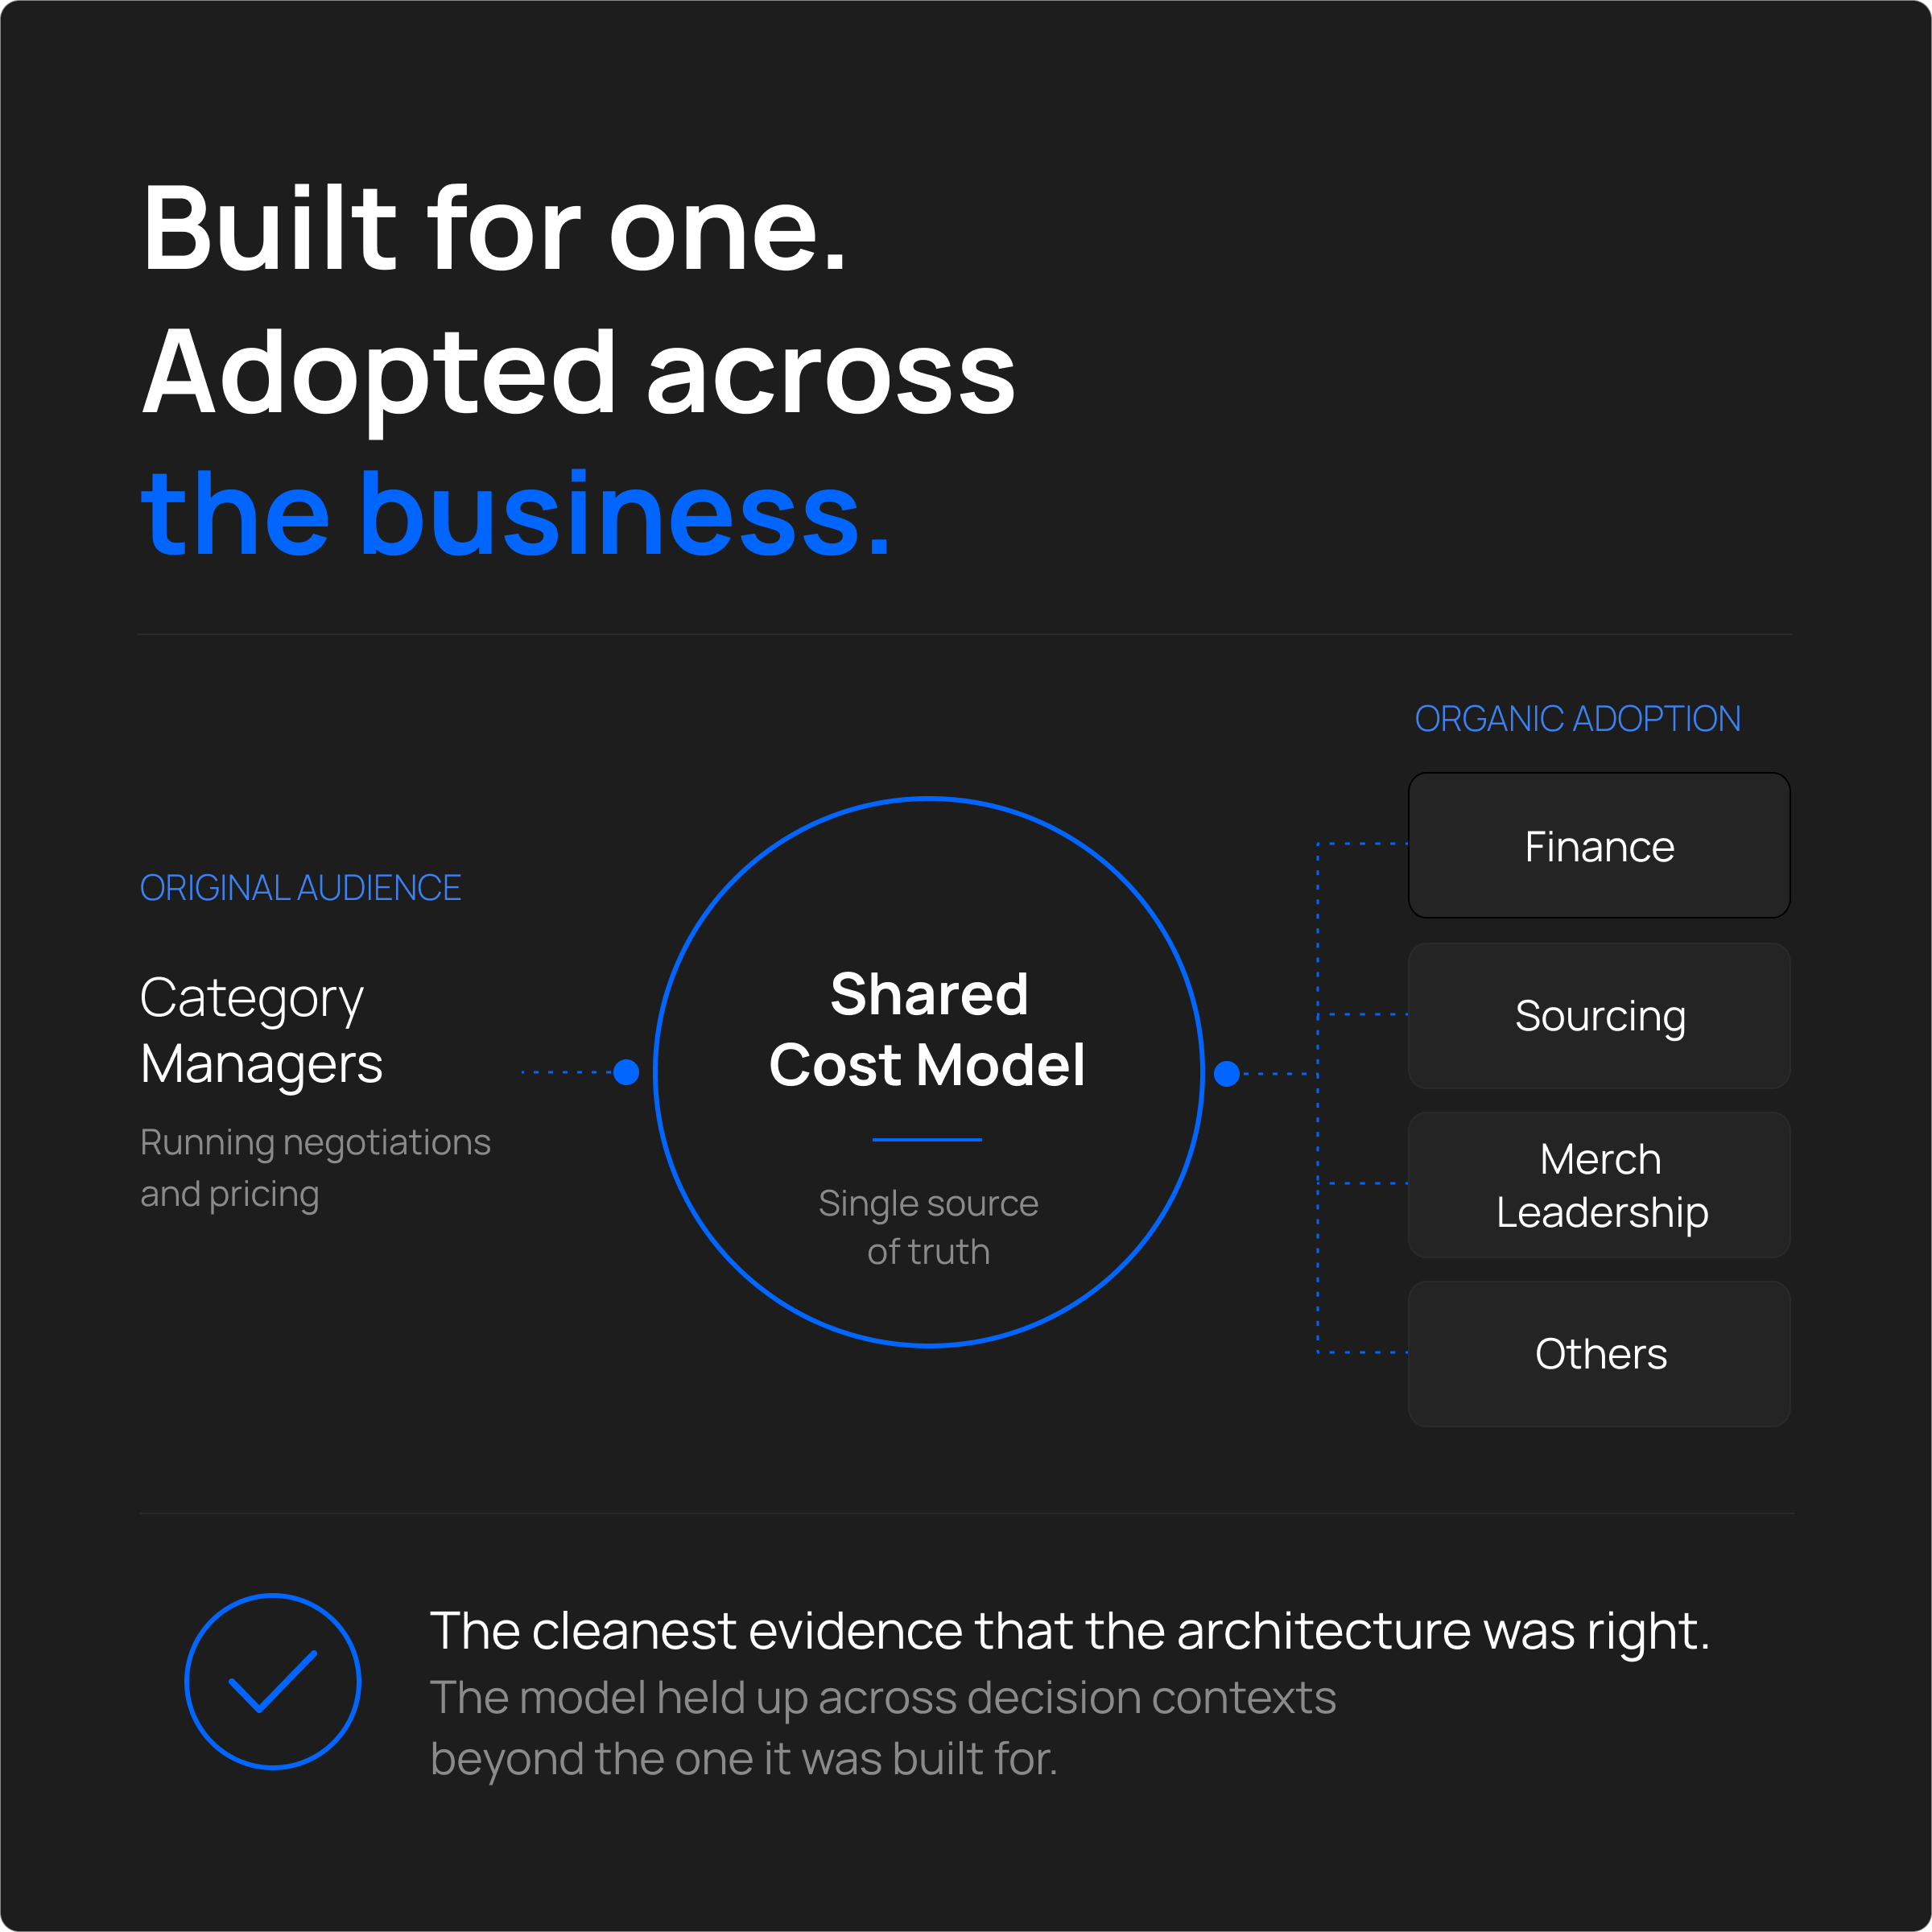
An architecture win, not a feature win.
Each adopting team came looking for something different, some to forecast assumptions, or vendor review prep, or planning-meeting context. None of it was on the roadmap. None of it needed new screens or new permissions.
The strongest validation came from cross-functional adoption. By separating raw cost data from business interpretation, the model created a flexible foundation that could support multiple decision contexts without forcing teams into conflicting workflows.
Shipped in 2023.
Revisited in 2026 with AI.
What this project would look like if I shipped it today.
After Kroger launched, I went back and re-ran two parts of the work with AI in the loop: the research synthesis and the prototype iteration. My goal was to understand where it could have moved the needle.
Claude was strongest on the data side: clustering hundreds of buyer interview notes and cost-change logs into recurring patterns, and drafting plain-language explanations for why a cost moved (the kind of context buyers used to have to dig out manually).
Figma Make rebuilt the historical view as an interactive prototype in an afternoon. The kind of "what if upcoming changes had the same visual weight as historical?" exploration that used to take a week of static comps now happens in real time, with real data shape.
The hardest part of this project wasn't the data architecture, it was getting three teams to agree on what the number meant before agreeing on what it said. Cost data is a coordination problem dressed up as a technical one.